Newsletters


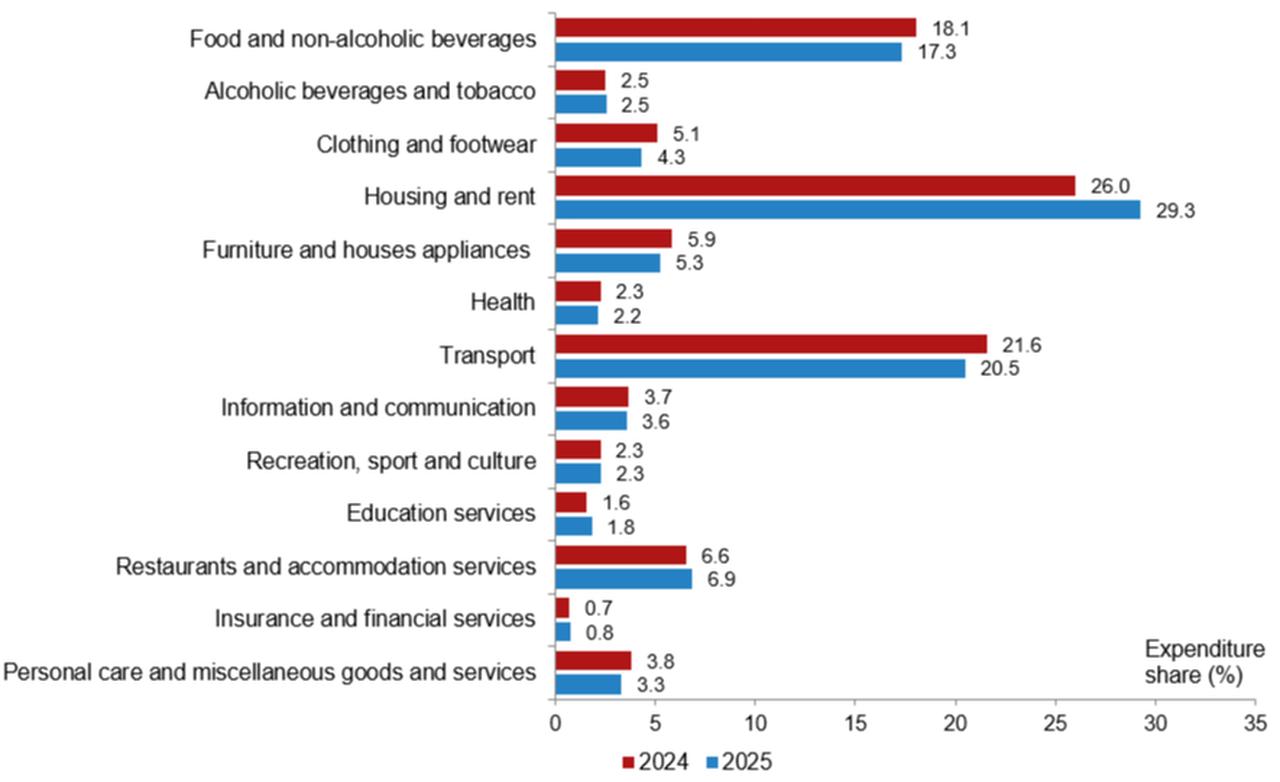
Housing and rent accounted for the largest share of household consumption spending in Türkiye in 2025, reaching 29.3% of total expenditures and marking the highest level since comparable records began in 2002.
According to the latest household consumption data released by the Turkish Statistical Institute (TurkStat), transportation ranked second with a 20.5% share, followed by food and non-alcoholic beverages at 17.3%.
Together, the three categories accounted for 67.1% of all household spending nationwide.
At the opposite end of the scale, insurance and financial services represented just 0.8% of consumption expenditures, the smallest share among all spending categories. Education services accounted for 1.8%, while health expenditures stood at 2.2%.
By household size, housing and rent accounted for 41% of expenditures among single-person households in 2025, while food and non-alcoholic beverages represented the largest spending category for households with six or more members at 23.7%, followed by housing and rent at 22.4% and transportation at 18.1%.
Average monthly household consumption expenditures reached roughly ₺64,104 ($1,618.2) during the year, of which ₺18,763 went toward housing and rent, ₺13,132 toward transportation, and ₺11,110 toward food and non-alcoholic beverages, making the three categories the largest components of household budgets.
Beyond essential expenditures, households spent an average of ₺4,398 per month on restaurants and accommodation services, more than double the ₺2,097 allocated to clothing and footwear, while recreation, sports and cultural activities accounted for ₺1,466 and education expenditures averaged ₺1,164 per household.

A breakdown by expenditure groups pointed to a growing concentration of consumption among higher-spending households.
The highest-spending 20% of households accounted for 47.2% of total consumption expenditures in 2025, meaning nearly half of all spending originated from a single group.
Meanwhile, the middle quintile's share fell to 14.8%, the lowest level in the available series, while the lowest-spending 20% accounted for just 6% of total expenditures.
Education showed the widest disparity, with the highest-spending 20% of households accounting for 78.9% of all expenditures in the category, compared with just 0.27% for the lowest-spending fifth, a gap of roughly 292-fold.
Similar differences appeared in transportation, where 74.7% of all expenditures originated from the highest-spending group.
Households in the highest-spending quintile accounted for 74.7% of transportation expenditures, alongside 62.5% of spending on insurance and financial services, 60% on recreation and culture, 57.3% on personal care services, and 55.8% on health, suggesting that spending on many services is increasingly concentrated among households with greater purchasing power.


 1 min read

 1 min read