Newsletters


Istanbul contains the largest share of households in Türkiye’s highest socioeconomic groups, while Cankaya in Ankara ranks highest among districts, according to the Turkish Statistical Institute (TurkStat) in its new report, "Socioeconomic Status (SES) 2023."
The study calculated a socioeconomic score for over 26 million households using administrative records, with 2023 as the reference year and data drawn from 2022 to 2024.
TurkStat describes the report as a measurement tool that looks at households’ social and economic status together.
For international readers: “socioeconomic status” here means a combined assessment of a household’s social position and economic resources, grouped from highest to lowest to show relative standing across the country.
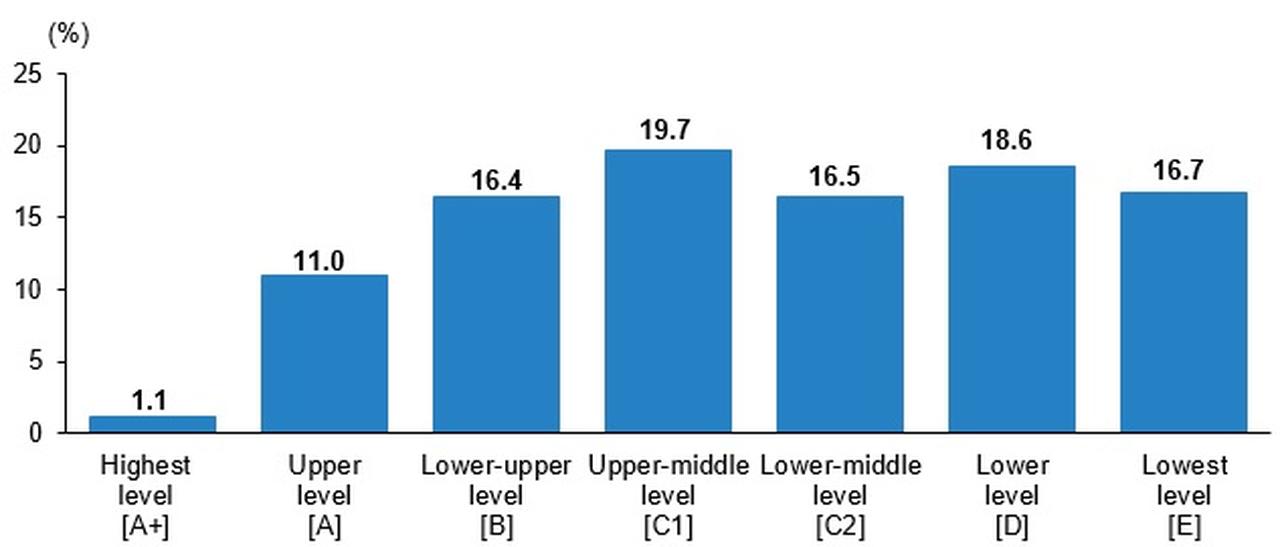

Across Türkiye, households were distributed along seven bands from highest to lowest. The national breakdown came out as 1.1% in the highest band, 11.0% in the upper band, 16.4% in the next band, and the remainder spread across the middle and lower bands.
The report therefore shows a relatively small share of households in the very top group and larger shares in the middle and lower groups.

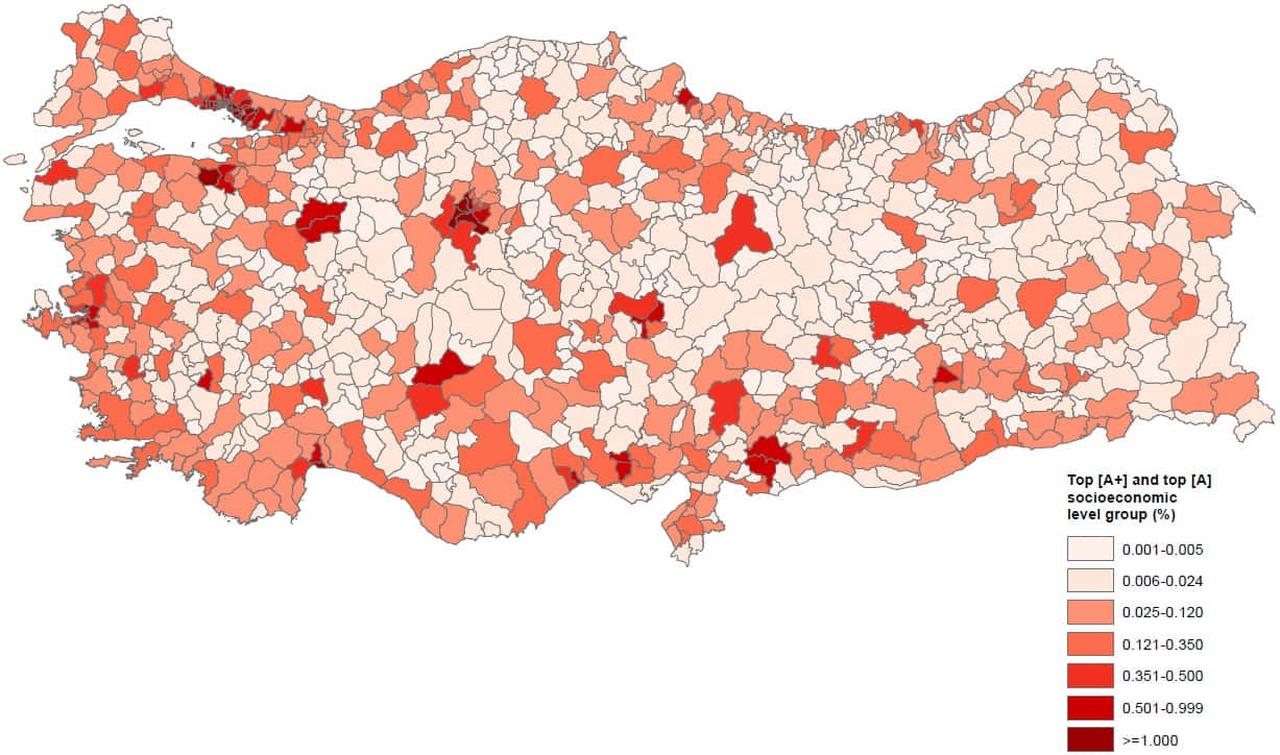
When the two top bands (labelled A+ and A) are combined to look at where the country’s better-off households are concentrated, Istanbul accounts for 28.6% of that total, followed by Ankara (11.5%) and Izmir (6.7%).
At the provincial level, the share of households in the single “highest” band was reported as 2.5% in Ankara, 2.4% in Istanbul, and 1.2% in Izmir.
At the district level, Cankaya (Ankara) held the largest share of A+ and A households at 4.1%, with Kadikoy (Istanbul) next at 2.4% and Yenimahalle (Ankara) at 1.9%.
When districts were ranked by average socioeconomic score, the seven highest-scoring districts were Cankaya, Kadikoy, Besiktas, Etimesgut, Nilufer, Bakirkoy, and Guzelbahce.
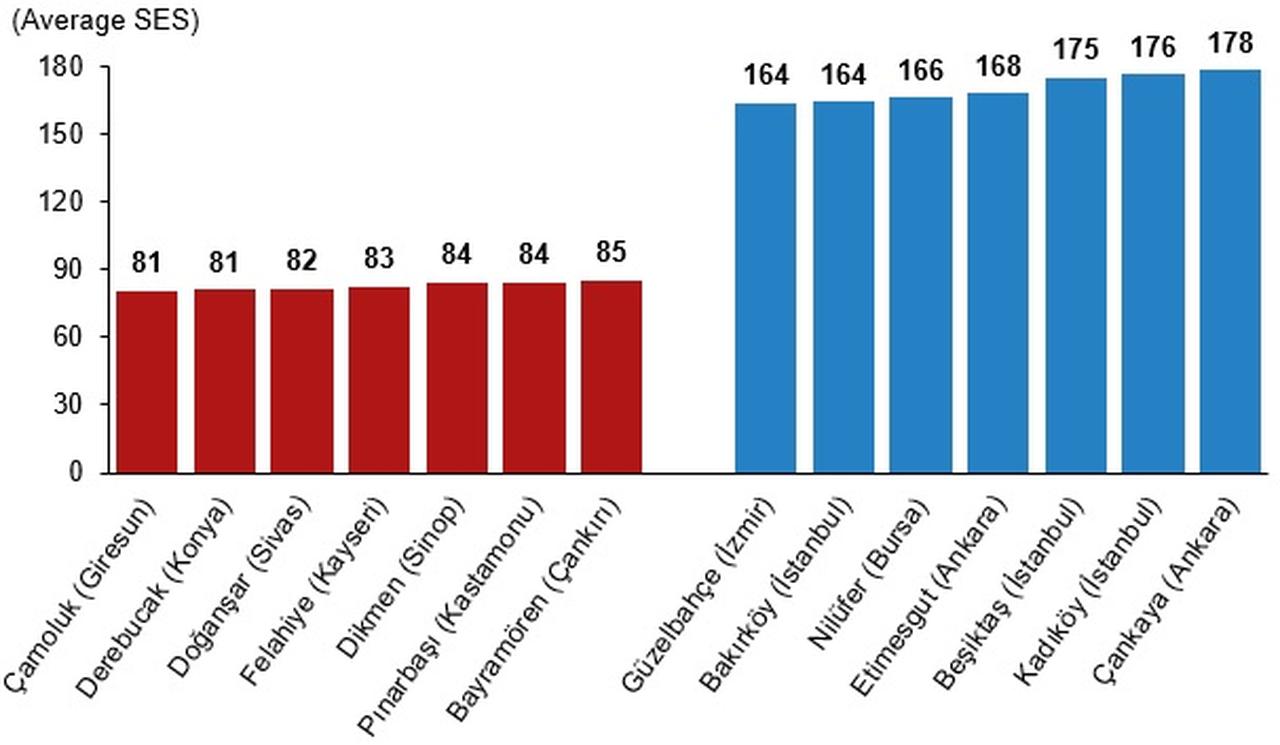
The seven lowest-scoring districts were Camoluk (Giresun), Derebucak (Konya), Dogansar (Sivas), Felahiye (Kayseri), Dikmen (Sinop), Pinarbasi (Kastamonu) and Bayramoren (Cankiri).
TurkStat ran the calculations for every household in its administrative records, covering over 26 million households, and set the mid-year 2023 as its reference point.
The report, therefore, offers a nationwide snapshot of where households sit on a combined social and economic scale and where the top groups are geographically concentrated.


 5 min read