Newsletters


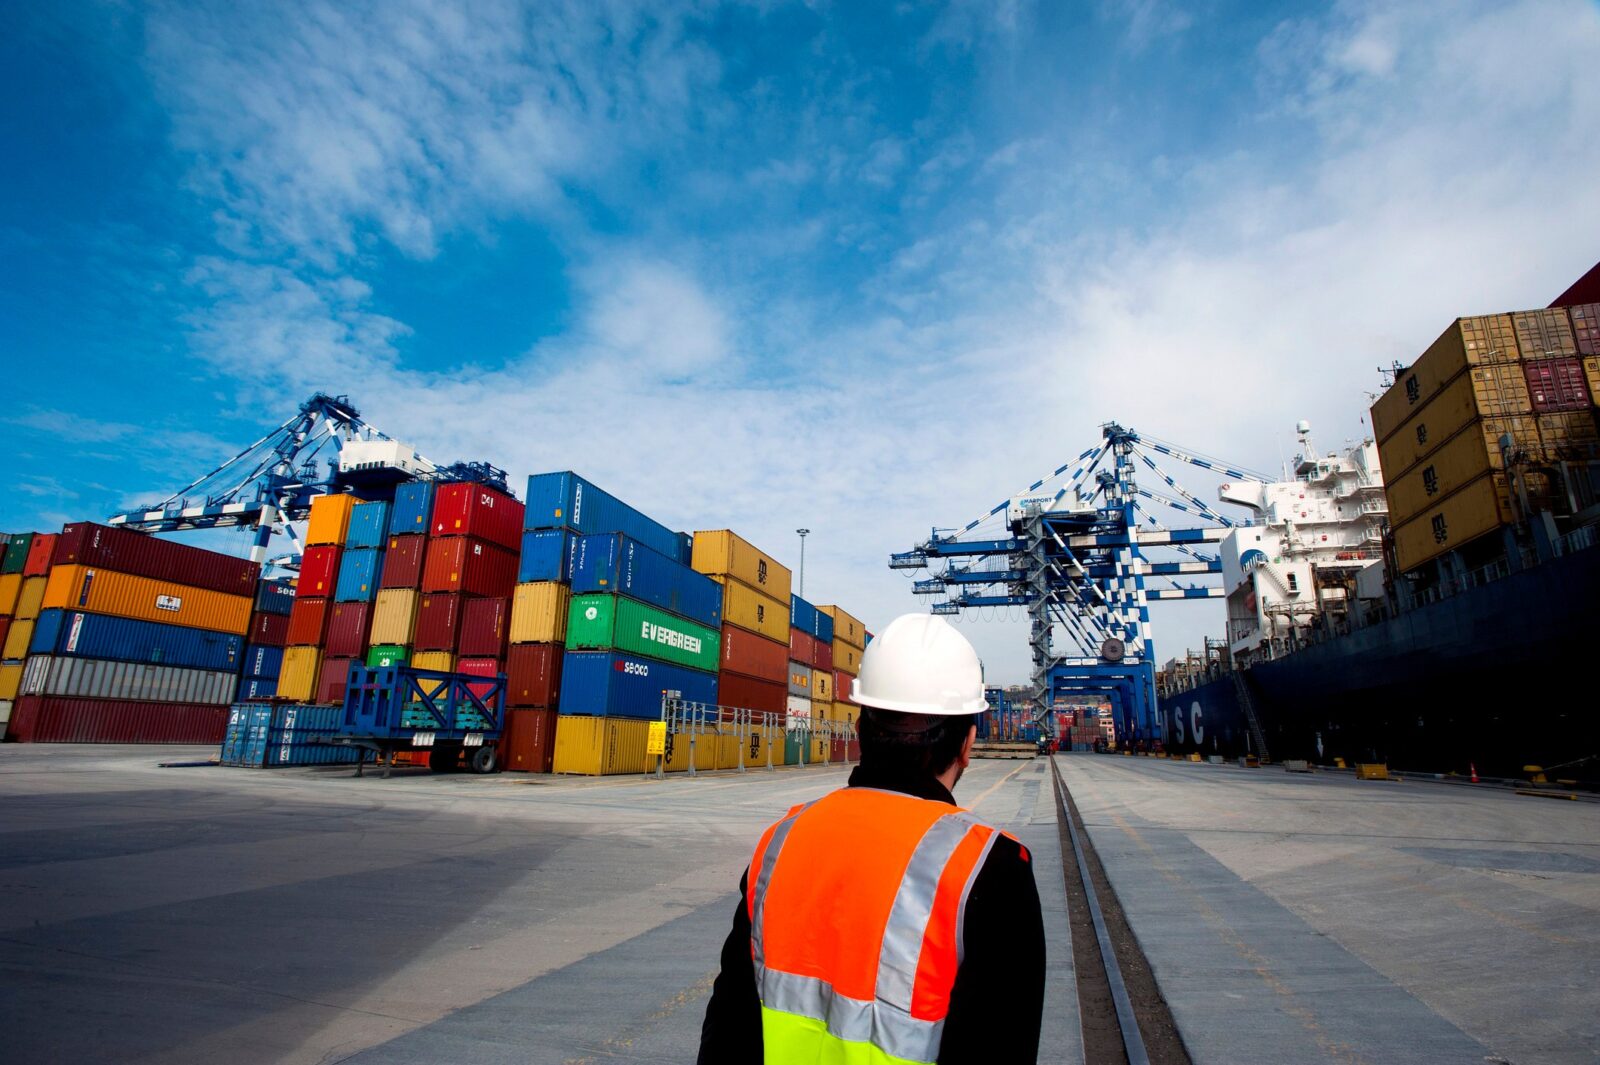
Türkiye's trade relationship with China has evolved into a complex and often troubling dynamic. While celebratory headlines highlight a 51% increase in exports to China, the underlying details reveal a more concerning picture.
As the notorious trade imbalance continues to grow year after year, China's imports from Türkiye primarily consist of raw materials rather than end products, to the disadvantage of Türkiye.
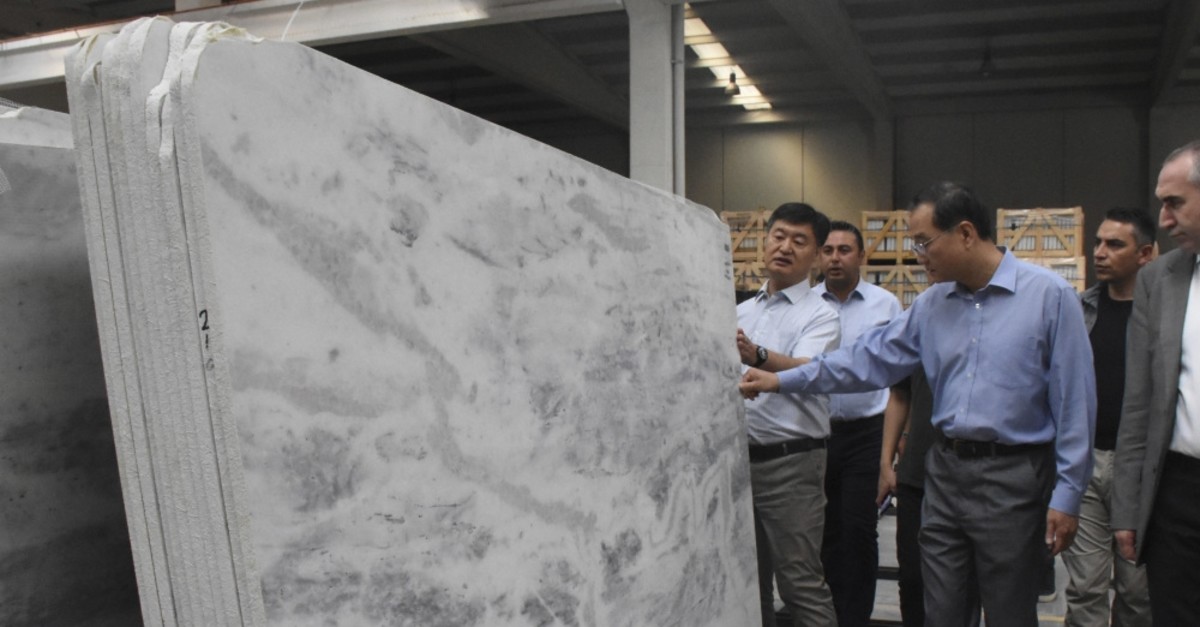

China's demand from Türkiye is heavily skewed toward raw materials and commodities. There has been a significant increase in the export of mining and chemical raw materials, with mining product exports doubling and chemical raw material exports increasing fivefold. Textile raw material exports have also seen a considerable rise.
Rank
Products
2020
2021
2022
Share (%) 2022
Change (%) 2021-2022
1
Marble and travertine
538,201
612,164
416,152
12.7
-32
2
Chromium ores and concentrates
98,474
191,008
250,478
7.6
31.1
3
Lead ores and concentrates
153,179
194,903
166,571
5.1
-14.5
4
Copper ores and concentrates
90,028
86,957
150,973
4.6
73.6
5
Precious metal ores and concentrates
174,997
153,850
145,027
4.4
-5.7
6
Refined copper and copper alloys (unwrought)
162,809
164,806
127,266
3.9
-22.8
7
Petroleum oils and bituminous minerals derived oils
22,722
25,617
126,073
3.8
392.1
8
Natural borates and their concentrates
58,614
88,519
110,935
3.4
25.3
9
Nickel mattes, nickel oxide sinters, and other products
62,542
55,968
95,553
2.9
70.7
10
Iron ores and concentrates
83,254
215,014
88,833
2.7
-58.7
Türkiye's major exports to China (Source: Türkiye's Trade Ministry supported by TurkStat data)
However, when it comes to processed goods, the situation is less encouraging. Exports of finished products have significantly declined. For example, exports of ready-made clothing, climate control products and electronic goods have all been cut in half.
Rank
Products
2020
2021
2022
Share (%) 2022
Change (%) 2021-2022
1
Telephone sets and other communication devices
2,485,006
2,681,079
2,254,300
5.5
-15.9
2
Automatic data processing machines
1,725,276
2,076,391
2,083,735
5.0
0.4
3
Stainless steel flat-rolled products
208,358
498,771
968,250
2.3
94.1
4
Diodes, transistors, and similar semiconductor devices
280,252
443,975
965,128
2.3
117.4
5
Polycarboxylic acids and their derivatives
55,758
347,064
859,374
2.1
147.6
6
Synthetic filament yarns
480,741
671,960
818,982
2.0
21.9
7
Other alloy steel flat-rolled products
129,127
506,731
729,527
1.8
44.0
8
Flat-rolled products of iron or non-alloy steel
573
170,894
728,296
1.8
326.2
9
Polyacetals, other polyethers, epoxide resins, polycarbonates, etc.
129,031
370,924
700,010
1.7
88.7
10
Electrical transformers and static converters
388,688
466,369
659,607
1.6
41.4
Türkiye's major imports from China (Source: Türkiye's Trade Ministry supported by TurkStat data)
Between the lines: It seems that China is strategically sourcing raw materials from Türkiye while reducing its imports of Turkish finished goods, reinforcing the idea that they prefer to control the production process themselves. As a major manufacturing hub close to Western markets, Africa, and the Middle East, Türkiye is at a disadvantage because its primary focus is on exporting end products to foreign markets.
China has consistently been a key trade partner for Türkiye, particularly on the import side. While China ranks 19th in Türkiye's export markets, it holds a much more significant position in terms of imports, indicating a persistent trade imbalance.
Türkiye's exports to China have remained relatively modest over the decade, ranging from approximately $2.3 billion to $3.7 billion. In contrast, China has been one of Türkiye's top import partners, reflecting China's role as a global manufacturing hub. The high level of imports relative to exports underscores Türkiye's reliance on Chinese goods, particularly in sectors like electronics, machinery, and textiles.
Year
Türkiye's exports to China (USD Thousands)
Türkiye's imports from China (USD Thousands)
Trade balance (USD Thousands)
2013
3,755,649
25,260,751
-21,505,102
2014
2,970,633
25,732,865
-22,762,232
2015
2,500,618
25,283,734
-22,783,116
2016
2,378,538
24,852,474
-22,473,936
2017
3,037,675
23,753,644
-20,715,969
2018
3,078,644
21,506,001
-18,427,357
2019
2,726,078
19,128,160
-16,402,082
2020
2,865,866
23,041,354
-20,175,488
2021
3,662,748
32,238,052
-28,575,304
2022
3,281,335
41,354,561
-38,073,226
2023
3,306,084
45,047,968
-41,741,884
Türkiye's trade with China from 2013 to 2023, highlighting exports, imports, and the resulting trade balance (Source: TurkStat)
China's global strategy is clear: they are stockpiling raw materials and agricultural products from around the world, including from Türkiye. This approach allows them to present the narrative of increasing imports from trade-deficit countries while minimizing economic disruption.
Türkiye's reliance on exporting raw materials while importing finished products from China could have long-term economic consequences, including increased trade deficits and dependency on Chinese goods. The current trend suggests that Türkiye's trade relationship with China is increasingly unbalanced, with potential risks for the Turkish economy.
The Turkish Ministry of Trade has decided to impose an additional customs duty on petrol and hybrid passenger cars imported from China to boost domestic production and reduce the trade deficit.
According to the decision published in the Official Gazette, imported vehicles originating from China are subject to an additional customs duty of '40% of the import value or $7,000 per unit, whichever is higher.'
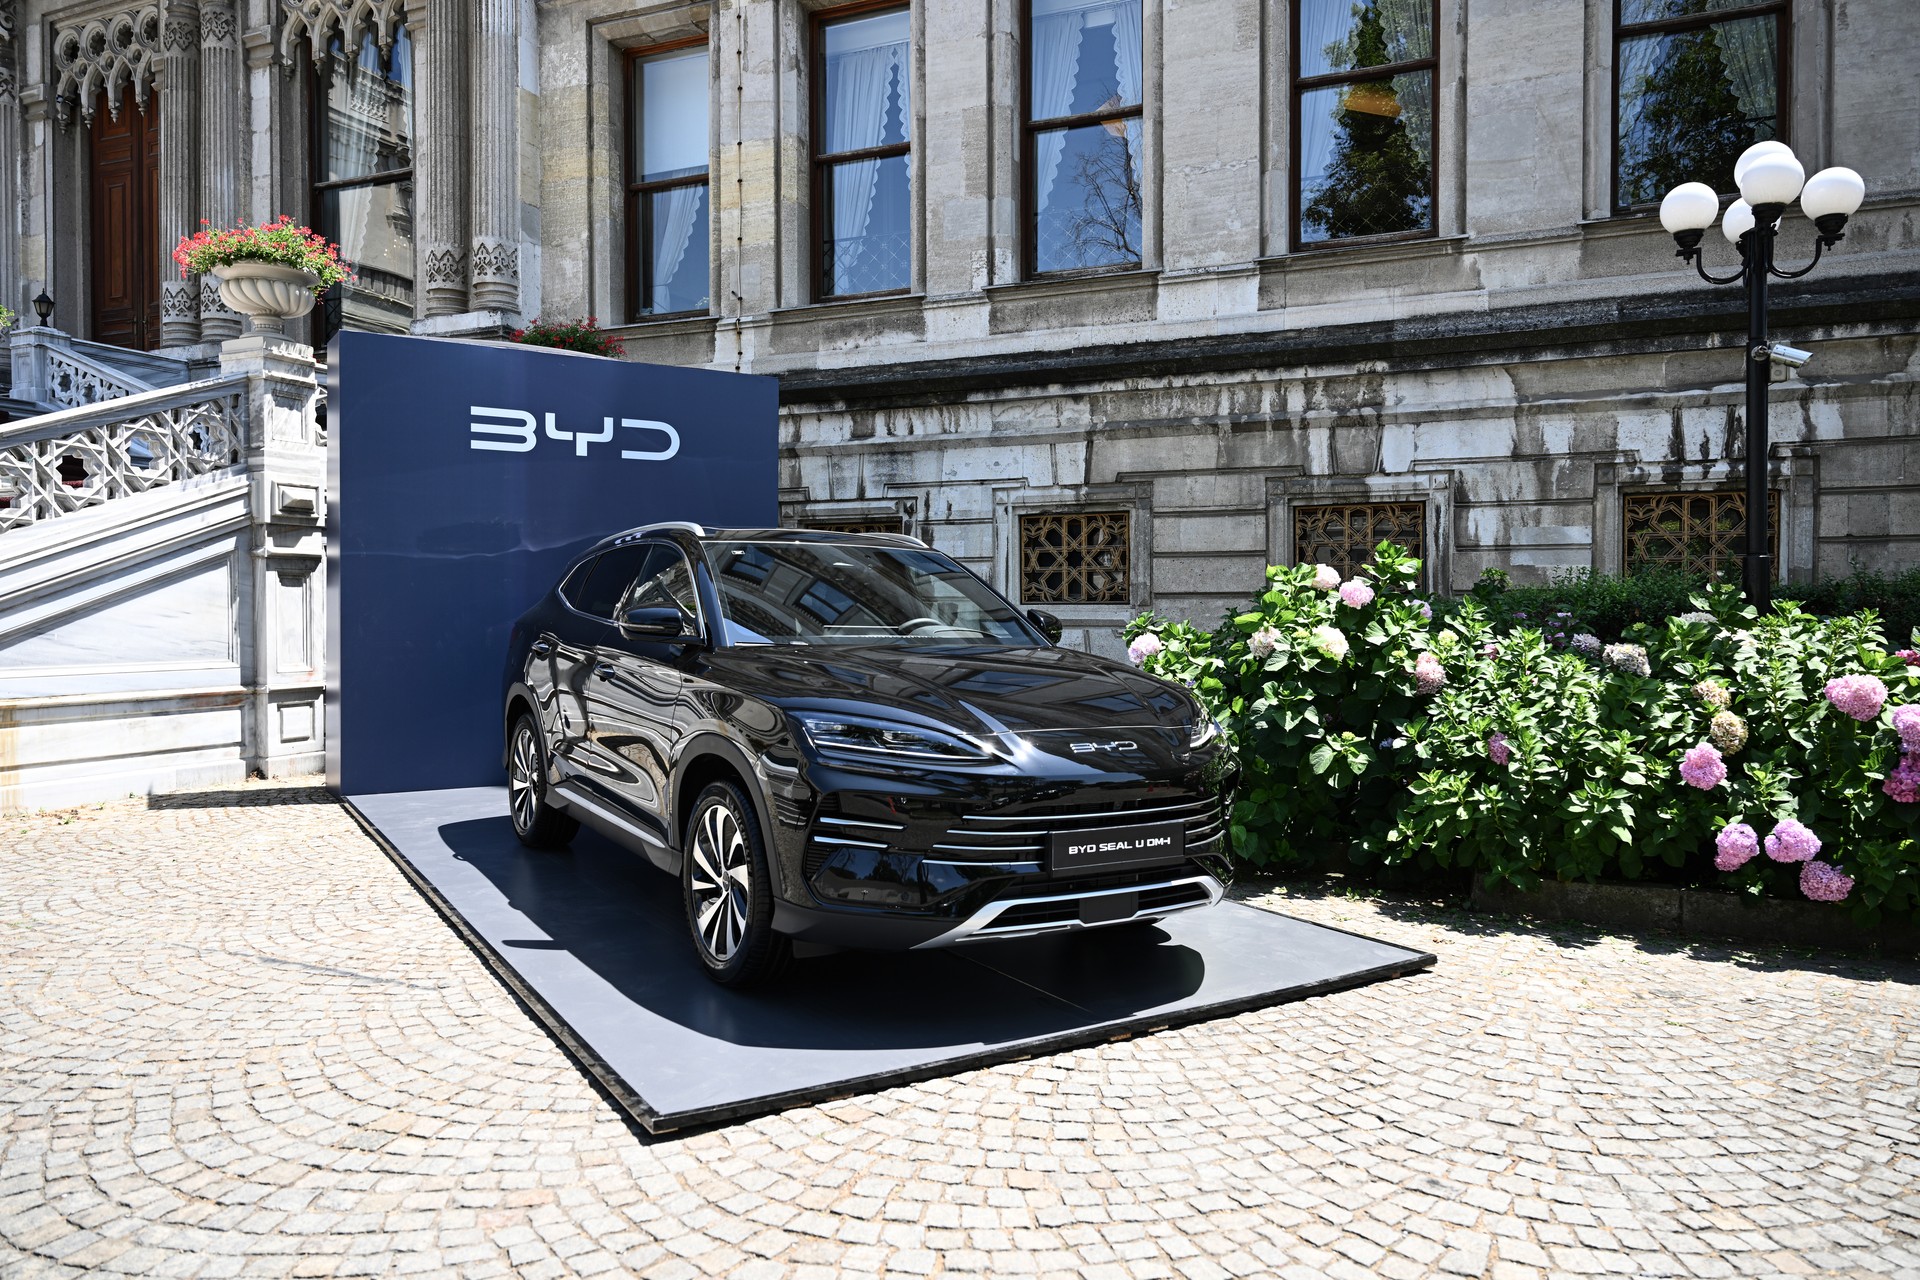
What's more: Chinese battery giant Ganfeng Lithium is set to make a $500 million investment in Türkiye through a strategic partnership with Yigit Aku.
Rank
Country
2023 (r)
2022
2021
2020
2019
1
Germany
21,083,354
21,141,783
19,311,023
15,978,698
16,617,244
2
USA
14,879,654
16,885,325
14,720,364
10,182,966
8,970,658
3
Iraq
12,759,358
13,750,276
11,125,650
9,142,047
10,223,292
4
United Kingdom
12,463,116
13,004,798
13,703,695
11,235,582
11,278,615
5
Italy
12,372,779
12,386,045
11,473,021
8,082,560
9,753,018
6
Russia
10,906,585
9,342,796
5,774,392
4,506,681
4,152,137
7
France
10,287,542
9,534,619
9,111,137
7,195,168
7,945,607
8
Spain
9,783,655
9,654,318
9,619,642
6,683,488
8,138,744
9
UAE
8,572,809
5,252,673
5,493,362
2,828,043
3,627,237
10
Netherlands
7,857,412
8,026,254
6,764,786
5,195,120
5,761,921
11
Romania
6,951,714
6,947,484
5,175,021
3,893,981
4,073,075
12
Poland
5,955,208
5,417,452
4,673,825
3,474,726
3,448,829
13
Israel
5,434,606
7,032,339
6,355,775
4,704,088
4,463,820
14
Belgium
4,365,608
4,778,506
4,899,300
3,634,672
3,396,193
15
Bulgaria
4,226,695
4,721,645
3,953,436
2,634,444
2,668,230
16
Greece
4,171,507
3,302,681
3,118,900
1,799,836
2,245,318
17
Ukraine
3,443,800
3,059,409
2,900,545
2,090,327
2,156,454
18
Egypt
3,352,651
4,556,656
4,513,693
3,136,160
3,508,791
19
China
3,306,084
3,281,335
3,662,748
2,865,866
2,726,078
20
Libya
3,257,338
2,840,774
2,771,261
1,653,076
2,069,497
Türkiye's top 20 export partners, showing the value of imports (in thousand USD) for each year from 2013 to 2023 (Source: TurkStat)
Rank
Country
2023 (r)
2022
2021
2020
2019
1
Russia
45,599,587
58,848,948
28,959,361
17,829,309
23,115,236
2
China
45,047,968
41,354,561
32,238,052
23,041,354
19,128,160
3
Germany
28,687,775
24,033,074
21,726,305
21,732,759
19,280,399
4
Switzerland
19,905,177
15,335,897
3,054,869
7,770,804
3,374,800
5
USA
15,779,725
15,228,078
13,147,623
11,524,951
11,847,373
6
Italy
14,994,186
14,082,252
11,562,694
9,199,617
9,349,593
7
France
11,547,686
9,429,702
7,931,536
6,988,074
6,760,064
8
UAE
11,530,205
4,470,951
2,442,660
5,603,801
4,388,996
9
Spain
9,507,243
7,004,013
6,311,611
5,039,428
4,446,113
10
South Korea
9,487,978
9,004,399
7,597,023
5,734,268
5,777,022
11
India
7,932,008
10,697,077
7,936,146
4,830,115
6,635,217
12
United Kingdom
6,523,078
5,904,556
5,558,194
5,582,666
5,638,296
13
Japan
5,466,847
4,640,815
4,389,292
3,743,373
3,647,962
14
Poland
5,074,133
4,294,369
3,635,826
3,005,108
2,603,243
15
Netherlands
4,420,492
4,497,087
4,508,587
3,628,586
3,202,985
16
Belgium
4,302,475
4,420,585
5,628,385
3,716,088
3,229,280
17
Brazil
4,139,999
4,830,904
3,827,073
3,228,347
2,655,109
18
Malaysia
4,139,184
4,288,755
3,098,059
1,989,963
1,847,831
19
Czech Republic
3,831,471
2,895,417
2,713,597
2,746,268
2,338,350
20
Ukraine
3,691,707
4,455,394
4,524,675
2,590,375
2,725,419
This table lists the top 20 countries from which Türkiye imports, showing the value of imports (in thousand USD) for each year from 2013 to 2023. (Source: TurkStat)


 2 min read